


ITG Engineering Guidelines Page 101 of
378
ITG Trunk 2.0 ISDN Signaling Link (ISL) Description, Installation and Operation
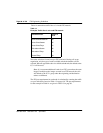
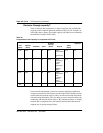
The bandwidth requirement calculation would be = (40/36)*11.2 +
(14/36)*33.6 = 25.51 kbit/s, where 14 CCS is the larger of two fax traffic
parcels (14 CCS as compared to. 6 CCS). After adjusting for peaking, the
incremental data rate on WAN for this route is 33.2 kbit/s. Compare this
number with 24.3 kbit/s when all 60 CCS is voice traffic, it appears that the
reduction in CCS due to one-way fax traffic (20 CCS as compared to 14 CCS)
will not compensate for higher bandwidth requirement of a fax as compared
to. voice call (33.7 kbit/s as compared to. 11.2 kbit/s) in this example.
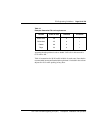
The example in this section deals with nodal traffic calculation in both
T-LAN and WAN. It indicates incremental bandwidth requirement to handle
voice on data networks.
Assess WAN link resources
For most installations, ITG traffic will be routed over WAN links within the
intranet. WAN links are the most expensive repeating expenses in the
network and they often are the source of capacity problems in the network.
Unlike LAN bandwidth, which is virtually free and easily implemented,
WAN links, especially inter-LATA and international links take time to obtain
financial approval, provision and upgrade. For these reasons, it is important
to determine the state of WAN links in the intranet before installing the ITG
network.
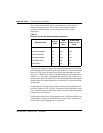
Each voice conversation, (G.729 Annex AB codec, 30 ms payload) consumes
11.2 kbit/s of bandwidth or 18.6 kbit/s with silence suppression disabled for
each link that it traverses in the intranet; a DS0 64 kbit/s WAN link would
support 5 simultaneous telephone conversations with silence suppression
enabled, or 2 simultaneous telephone conversations with silence suppression
disabled.
Link utilization
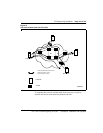
The starting point of this assessment is to obtain a current topology map and
link utilization report of the intranet. A visual inspection of the topology map
should reveal which WAN links are likely to be used to deliver ITG traffic.
Alternately use the tool (see “Measure intranet QoS” on
page 114).
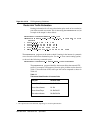
The next step is to find out the current utilization of those links. Note the
reporting window that appears in the link utilization report. For example, the
link utilization can be averaged over a week, a day, or one hour. In order to