


Page 102 of
378
ITG Engineering Guidelines
553-3001-202 Standard 1.00 April 2000
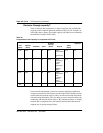
be consistent with the dimensioning considerations (see “ITG traffic
engineering” on page 76), obtain the busy period (e.g. peak hour) utilization
of the trunk. Also, because WAN links are full-duplex and that data services
exhibit asymmetric traffic behavior, obtain the utilization of the link
representing traffic flowing in the heavier direction.
The third step is to assess how much spare capacity is available. Enterprise
intranets are subject to capacity planning policies that ensure that capacity use
remains below some determined utilization level. For example, a planning
policy might state that the utilization of a 56 kbit/s link during the peak hour
must not exceed 50%; for a T1 link, the threshold is higher, say at 80%. The
carrying capacity of the 56 kbit/s link would be 28 kbit/s, and for the T1
1.2288 Mbit/s. In some organizations the thresholds can be lower than that
used in this example; in the event of link failures, there needs to be spare
capacity for traffic to be re-routed.
Some WAN links may actually be provisioned on top of layer 2 services such
as Frame Relay and ATM; the router-to-router link is actually a virtual circuit,
which is subject not only to a physical capacity, but also a “logical capacity”
limit. The technician needs to obtain, in addition to the physical link capacity,
the QoS parameters, the important ones being CIR (committed information
rate) for Frame Relay, and MCR (maximum cell rate) for ATM.
The difference between the current capacity and its allowable limit is the
available capacity. For example a T1 link utilized at 48% during the peak
hour, with a planning limit of 80% had an available capacity of about 492
kbit/s.
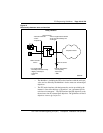
Estimate network loading
caused by
ITG traffic
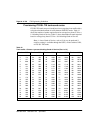
At this point, the technician has enough information to "load" the ITG traffic
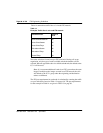
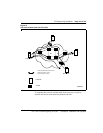
on the intranet. Figure 13 illustrates how this is done on an individual link.
Suppose the intranet has a topology as shown in Figure 13, and you want to
predict the amount of traffic on a specific link, R4-R5. From the “ITG traffic
engineering” section and measurements, the R4-R5 link is
expected to support the Santa Clara/Richardson, Santa Clara/Tokyo and the
Ottawa/Tokyo traffic flows; the other ITG traffic flows do not route over
R4-R5. The summation of the three flows yields 93 CCS or 24 kbit/s as the
incremental traffic that R4-R5 will need to support.