


ITG Engineering Guidelines Page 117 of
378
ITG Trunk 2.0 ISDN Signaling Link (ISL) Description, Installation and Operation
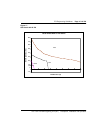
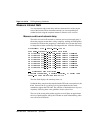
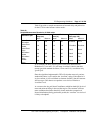
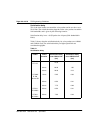
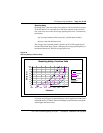
Table 20 provides a sample measurement of network delay and packet loss
for the G.729A codec between various nodes.
Table 20
Sample Measurement Results for G.729A codec
As an example, the delay and loss pair of traffic from Santa Clara to
Richardson (171 ms and 1.5%) will meet “excellent” criterion, but their
counter part with standard deviation (179 ms and 2.1%) can achieve only
“good” QoS.
Since the algorithm implemented in ITG will calculate mean only and not
standard deviation, it will confirm the “excellent” rating (if the objective is
set for excellent, it will not fallback to alternate facilities), but the customer
will have up to 50% chance to experience a service level inferior to
“excellent” level.
As a contrast, the site pair Santa Clara/Ottawa which has both QoS levels of
mean and mean+σ falling in the excellent region. The customer will have
more confidence that (better than 84% chance under the assumption of
Normal distribution) during peak traffic period, the “excellent” service level
is likely to be upheld.
Destination pair
Measured One way
delay (ms)
Measured Packet
loss (%)
Expected QoS level
(See page 143)
Mean
Mean+
σ
Mean
Mean+
σ
Mean
Mean+
σ
Santa Clara/
Richardson
171 179 1.5 2.1 Excellent Good
Santa Clara/
Ottawa
120 132 1.3 1.6 Excellent Excellent
Santa Clara/
Toky o
190 210 2.1 2.3 Good Good
Richardson/
Ottawa
220 235 2.4 2.7 Good Good
Richardson/
Toky o
305 345 2.2 2.6 Good Fair
Ottawa/
Tokyo
260 286 2.4 2.8 Good Fair