


Page 106 of
378
ITG Engineering Guidelines
553-3001-202 Standard 1.00 April 2000
Decision:
Enough
capacity?
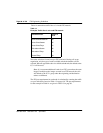
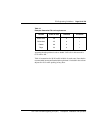
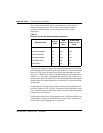
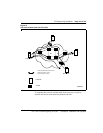
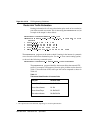
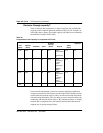
Table 19 arranges the computations so that for each link, the available link
capacity can be compared against the additional ITG load. For example, on
link R4-R5, there is plenty of available capacity (492 kbit/s) to accommodate
the additional 24 kbit/s of ITG traffic.
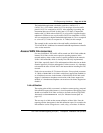
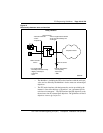
Some network management systems have network planning modules that
compute network flows in the manner just described. These modules provide
more detailed and accurate analysis as they can take into account actual node,
link and routing information. They also help you assess network resilience by
conducting link and node failure analysis. By simulating failures, re-loading
network and re-computed routes, the modules indicate where the network
might be out of capacity during failures.
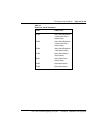
Table 19
Computation of link capacity as compared to ITG load
Link Utilization (%)
Available
capacity
(kbit/s)
Incremental ITG load
Sufficient
capacity?
End-
points
Capacity
(kbit/s)
Threshold Used Site pair
Traffic
(kbit/s)
R1-R2 1536 80 75 76.8 Santa
Clara/Ottawa
+
Ottawa/Toky
o
21.2 Yes
R1-R4 1536 80 50 460.8 Santa
Clara/Tokyo
+ Santa
Clara/
Richardson
+
Ottawa /
Tok y o
31.4 Yes
R4-R5 1536 80 48 492 Santa
Clara/Richar
dson
+ Ottawa/
Tokyo +
Santa
Clara/Tokyo
31.4 Yes
Etc.