


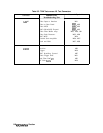
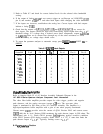
A3 Assembly Video Circuits
Voltages from
A3JlOl
to the A3 Variable Gain Amplifier correspond (approximately)
to on-screen signal levels. (One volt corresponds to the top of the screen and zero volts
corresponds to the bottom of the screen.) This is true for both log and linear settings except
when the spectrum analyzer is in 1 dB/div or 2
dB/d’
iv. In these cases the log expand
amplifier is selected, and 1 V corresponds to top-screen and 0.8 or 0.9 V corresponds to
bottom-screen. The spectrum analyzer can be set to zero span at the peak of a signal to
generate a constant dc voltage in the video circuits during sweeps.
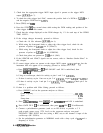
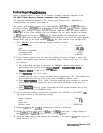
1. Disconnect W26 from
A3JlOl
and W20 from A2J4.
2. Connect W26 to A2J4.
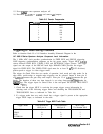
3. Set the spectrum analyzer to the following settings:
Span
. . . . . . . . . . . . . . . . . . . . . . . . . . . . . . . . . . . . . . . . . . . . . . . . . . . . . . . . . . . . OHz
Sweep time
. . . . . . . . . . . . . . . . . . . . . . . . . . . . . . . . . . . . . . . . . . . . . . . . . . . . . 20ms
Resolution bandwidth
. . . . . . . . . . . . . . . . . . . . . . . . . . . . . . . . . . . . . . . . . . . . 1 MHz
Log/division
. . . . . . . . . . . . . . . . . . . . . . . . . . . . . . . . . . . . . . . . . . . . . . . . 10 dB/DIV
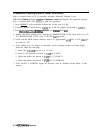
4. If a trace is displayed, troubleshoot the A3 assembly. If a trace is absent, connect an
oscilloscope to the rear-panel BLKG/GATE OUTPUT.
5. The presence of a TTL signal (TTL low during 20 ms sweep) indicates a good A3
Interface Assembly. Troubleshoot the IF section.
6. If the BLKG/GATE OUTPUT
is always at a TTL high or low, troubleshoot the A3
trigger/video gating circuits.
7. Reconnect W26 to
A3JlOl
and W20 to A2J4.
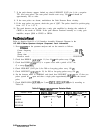
8. Remove the A3 assembly shield.
9. If the video filters appear to be faulty, refer to “Video Filter” in this chapter.
10. If there appears to be a peak detector problem, refer to “Positive/Negative Peak
Detectors” in this chapter.
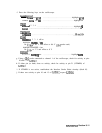
11. Connect the spectrum analyzer CAL OUTPUT to the INPUT
50R
and set the controls as
follows:
Center frequency
. . . . . . . . . . . . . . . . . . . . . . . . . . . . . . . . . . . . . . . . . . . .
..300MHz
Span
. . . . . . . . . . . . . . . . . . . . . . . . . . . . . . . . . . . . . . . . . . . . . . . . . . . . . . . . . . . . OHz
Reference level
. . . . . . . . . . . . . . . . . . . . . . . . . . . . . . . . . . . . . . . . . . . . . . . -10
dBm
12. If the spectrum analyzer works correctly in 5 dB/div and 10 dB/div but not in 1 dB/div
or 2
dB/div,
refer to “Log Offset/Log Expand” in this chapter. Continue with step 13 if
the problem involves on-screen amplitude errors which appear to originate in the video
chain.
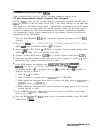
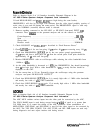
13. Press
ICALl
and IF AD3 ON OFF until OFF is underlined. Monitor
A3TP9
with an
oscilloscope. If the voltage is not approximately
+l
Vdc, troubleshoot the Log Amplifier
on A4. (Refer to the IF troubleshooting procedure in Chapter 9, “IF Section.“)
14. To confirm proper video input to the video circuit, set the spectrum analyzer to Log
10 dB per division and change the reference level in 10 dB steps from -10
dBm
to
j-30
dBm.
At each 10 dB step, the input voltage should change 100 mV. The input level
should be
to.6
Vdc for a j-30
dBm
reference level.
8-14
ADC/lnterface
Section