


6. TTL-level pulses should be observed. If the signal is either always high or always low, the
display will be blanked; suspect the A2 controller assembly.
7. If the signals on A2J202 pins 3, 14, and 15 are correct, troubleshoot the Al7 CRT driver.
Display Distortion
The HP 85623 spectrum analyzer uses a vector display. The graticule lines, traces, and
characters are composed of a series of straight lines (“vectors”) placed end-to-end. If the
vectors do not begin and end at the proper points, the display appears distorted, but in focus.
Symptoms range from characters appearing elongated and graticule lines not meeting squarely,
to an entirely unreadable display.
1. If the spectrum analyzer is in external frequency reference mode (an
“X”
is displayed
along the left side of the display), ensure that an external 10 MHz reference is supplied.
Otherwise the 16 MHz CPU clock will be off-frequency, causing distortion.
2. Use the CRT ADJ PATTERN to check for distortion. Press (CAL), MORE
I
OF 2, and
CRT
AD3
PATTERN (which is the top softkey). If vector distortion (described above)
occurs, perform the “Display Adjustment” in Chapter 2, “Adjustment Procedures,” to
test the function of the A2 controller assembly.
3. If there is distortion along with slight focus degradation, but the graticule lines meet (not
necessarily squarely), the Al7 CRT driver, CRT, DDD/TRACE ALIGN adjustments, or
cable connections might be at fault.
4. Perform the “16 MHz PLL Adjustment” in Chapter 2, “Adjustment Procedures.” If the
16 MHz CPU clock is off-frequency, the display will be distorted.
5. Perform the “Display Adjustment” in Chapter 2, “Adjustment Procedures.” Isolate the
problem to either the X or Y axis by noting the behavior of the adjustments. If the line
generator or fast zero-span portion of the adjustment fails, troubleshoot the A2 controller
assembly.
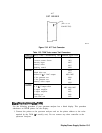
6. If the adjustments do not remedy the problem, set the spectrum analyzer
(LINE]
switch to
the off position and place the Al7 CRT driver in the service position.
7. Distortion confined to one axis (vertical or horizontal only), indicates a faulty Al7
assembly X or Y deflection amplifier. Use the alternate good deflection amplifier for
obtaining typical voltages. (There is enough symmetry in a typical display that the
voltages should be similar between these circuits.)
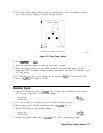
8. Monitor the waveforms at
A17TPll
and
A17TP14
(or TP12 and TP13). The 50 to
100 Vp-p ac component of the waveforms at the X and
x
(or Y and Y) outputs should be
mirror images of each other. The dc average should be 55 V.
9. The appropriate POSN adjustment (A17R57 or A17R77) should change the dc component
of both X and
x
(or Y and
y)
outputs in opposite directions.
10. The appropriate GAIN adjustment (A17R55 or A17R75) should change the ac component
in both outputs by the same amount.
11. If the display is a single dot, check that the base of A17Q18 is at -10.3 V f0.3 V. Verify
the signals at
TPll,
TP14, TP12, and TP13.
13-8 Display/Power Supply Section