


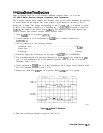
4.00
V/div
2.50 V
2.0 us/div 96.00 us
I
I
I I I
I
I
I I
I I
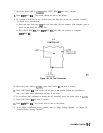
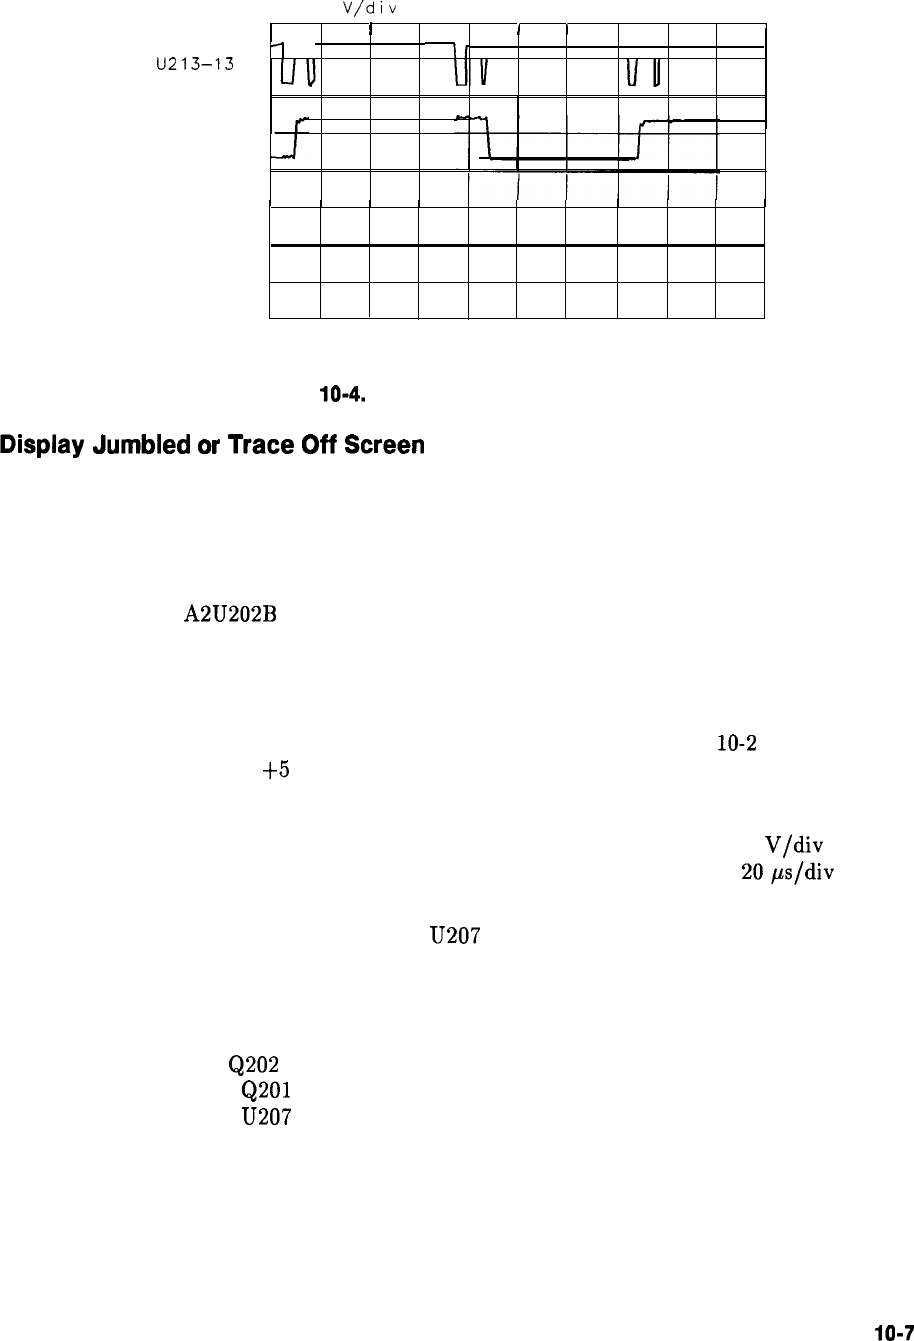
U213-13
BLANKING
i
nr
\I
II
II II
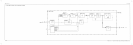
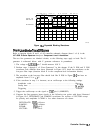
Figure
10-4.
Expanded Blanking Waveforms
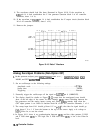
SK193
Display
Jumbled
or
Trace
Off
Screen
Refer to function blocks D and I of A2 controller schematic diagram (sheet 1 of 4) in the
HP 8560 E-Series Spectrum Analyzer Component Level Information.
The two line generators are identical circuits, so the following steps apply to both. The X
generator is referenced below, with Y generator references in parentheses.
1. The voltage at A2U202B pin 7 should measure 10.0 V.
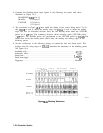
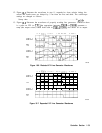
2. Perform steps 1 through 5 of “Line Generators” in this chapter. If the X POS and Y POS
waveforms look different from those illustrated in Figure 10-2, check the waveforms at the
low-pass filter input (function block E in the component-level information binder).
3. The waveform at the low-pass filter should look like X POS in Figure
10-2
but have an
amplitude from 0 V to
+5
V.
4. If the waveform in step 3 is incorrect, set an oscilloscope to the following settings:
Amplitude scale
. . . . . . . . . . . . . . . . . . . . . . . . . . . . . . . . . . . . . . . . . . . . . . . 10
V/div
Sweep time
. . . . . . . . . . . . . . . . . . . . . . . . . . . . . . . . . . . . . . . . . . . . . . . . . .
20ps/div
Triggering
. . . . . . . . . . . . . . . . . . . . . . . . . . . . . . . . . . . . . . . . . . . . . . . . . . . . External
5. Trigger the oscilloscope on the signal at U207 pin 8 (LBRIGHT).
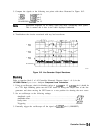
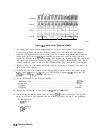
6. Compare the line-generator input signals at the following test points with those illustrated
in Figure 10-5. INTEGRATE and SAMPLE waveforms are replicas of VECTOR except
for polarity and amplitude. LCHAR is low when characters are drawn.
INTEGRATE:
Q202
collector
SAMPLE:
Q201
collector
LCHAR:
U207
pin 9
VECTOR:
U213 Pin 9
Controller Section
10-7