


o
o
o
a
I
o
o
I
O
o
o
O
O
o
I
o
a
I
a
a
o
o
a
o
o
I
o
O
I
o
a
O
I
o
a
a
o
o
O
o
o
o
o
o
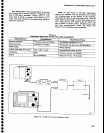
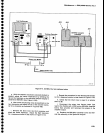
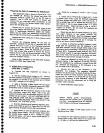
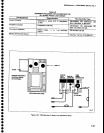
Preparing
the
2nd
LO
Assembly
lor
Adjustment
..
T_":!
_"guipment
setup
is
shown
in
Figure
6-19.
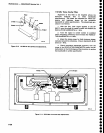
Turn
the POWER
off.
Rernove
the
cabinet
and place
the
Spectrum
Analyzer_upside
Oown
io-ine
nf
Oect<
is
exposed.
Use
a
5/16
inch
wrench
to
loosen
and
remove
the
two semi-rigid
cable
connections
to
the
assembly.
Remove
the
flexible
coaxial
cable
connec_
tion
to
the't00
MHz
input.
Remove
the
14
screws
that
hotd
the cover
on
the
mu-metaf
section
and
remov€
the
cover.
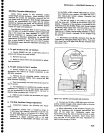
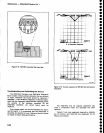
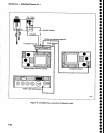
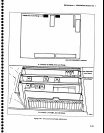
Unsolder
the
feads
to
feedthrough
capacitors
CZidS
and
CZ2O4.
fl'hese
are
the
center
two
feedthrougfr
lerminals
that
feed
through
the
circuit
board,
as
strovin
in'figure
O-iOj
Replace
the
cover
using
two
or
three
screws
to
hotd
the cover
in
place.
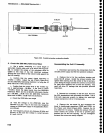
Remove
the mounting
screws
for
the
2nd
LO
131e1OtV.
Carefuly
tift
the
2ncr
LO
assembty
from
tnl
chassis
and
turn
it
over
so
the
machin€d
aluminum
housing
is
up.
Be
sule
that
the
pawer
input
"onn""-
tions remain
intact.
place
the
ars"ruty
on
a
flat
sur-
I"9::
U1e
a
5/64
Ailen
wrench
to remove
the
screws
holding
the
lid
on
the
machined
atuminum
housing,
and
r".T9ug.
the
tad,
exposing
the
three
RF
circuit
boards
within
the osciffator
section.
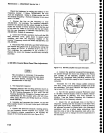
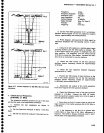
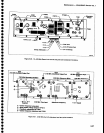
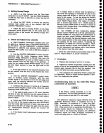
Install
a
50O
terminator
on
the
21g2
MHz
buffEred
output port,
p222,
(see
Figure
6_21).
2. Adjust
2nd
LO
Frequency
(2182
MHz
*t
MHz)
a.
Connect
the
test
equipment
as
shown
in
Figure
6-19.
b.
Set
the
variable pow€r
supply
to
0
V.
Connect
the
plus
posifive
(+)
terminat
to
ttri'enO
LO housing
and
the.
ne-gative
(-)
terminal
to
the
exposeO
Lno
ot
CZ2OI
and
L2031,
through
a
1
kO
resistor.
c.
Appty
a
100
MHz,
0_dBm
signal
from
the
signat
generator
to
the
100
MHz
Referenie
input port,
p221.
(Frequency
must
be
within
20
kHz
of
10O
MHi.)
d.
Connect
the
test
spectrum
analyzer
to
the
21g2
MHz.
unbuffered
output
port,
p220.
tni"
is
the
test
spectrum
analyzer
with
the reference
frequency
position
lr.fry- :gllp
in
step
1.
Do
Nor
posinou
exy
op
THE
CABLES
OVER
THE
2ND
LO
ASSEMBLY
OSCIL-
LATOR
SECTION
BECAUSE
THEY
CAN
AFFECT
THE
FREQUENCY
OF
THE
OSCILLATOR.
e.
Bend
the
feedback
and
frequency
adjusting
tabs,
C1021 and
C1922 (C
and
D
in
Figure
O'-Ztiso
they
are
approximately
30 degrees
above
the
board
surface.
-
f.
Apply power
to
both
the
Spectrum
Analyzer
and
the variable power
supply.
Set
the
voltage
output
from
the variabte
powsr
supply
to
5.0
V.
Votiige
on
C2203
should
now
equal,
-S
V
and
a
signal
strout-tO
appear
on
the
test spectrum
analyzer.
Maintenance
_
4g4[l494Ap
Servtce
Vot.
1
g.
Check
for a
voltage
of
*10.0
V,
r0.7
V
across
c2023.
h.
Check
Vbe
at Tplols
(B
in
Figure
6-21).
tf Vbe
ls
greater
than +0.9
V,
push
the
feeaback
adjustment
tab
down
stightly
and
it
tess
than
_0.9
V,
tift
tha
tab.
lf
Vbe
is
greater
than
+O.g
V,
replace
the microstrip
oscil-
lator
board.
lf Vbe
is
more
negative
than
_1
V,
check
th:9T
circuitry.
Adjust
tne
iaO so
Vbe
is
+0.15V,
t0.O5V
at
Tplois.
Do
not
touch
the
feedback
tab
whilE
measuring
voltages.
i,
Check
that the
2nd
LO
signal
(frequency)
is
within
9j'9-
major
division
of
the
center
Sratiiute
tine
(2.181
GHz
to
2.18it
cHz).
B,end
the freq-uency
adjust_
ment
tab
c1022
(D
In Figure
6_21)
to
bring
the oscitiator
within
tolerance.
(Bend
the
tab
up
tt
increase
fre_
quency
and
down
to lower
frequency.)
j.
lf unable
to
bring
the oscillator
frequency
within
rry-e
with
the adjustment
tab,
the
frequency
of
the
2182
MHz
osciilator
can
be
brought
within
range
of
the
adiustmen-t
tab
by short€ning
a
transmission
line stub (A
in
Figure
6-21).
Graduation
marks
along
the
side
of
the
stub provide
a
guide
to
calculate
trequency
corr€ction.
Each
minor
mark
from
the end
or cui
across
the
stub,
represents
an approximate
change
of 25
MHz.
k.
Check
the frequency
by noting
the
t€st spectrum
analyzer
disptay.
tf
the
frequency
is
too
high,
ihe
stub
must
be
lengthened
by
soldering
a
bridge
across
th€
cut.
Recheck
the freguency.
lf
the
frequency
is
too
low,
the
stub
must
be shortened
l.
Shorten the
line
so
the frequency
is
near
2200
MHz.
For
example:
The freguency
difference
between
the
desired
and
tho
actual
divideO
Oy eS
UH.,
equals
the number
of
minor
divisions
from
the line
end
for
the
new
cut.
Make
a cut
across
thE line
and
check
that
the
new
frequency
is near
2200
MHz.
Repeat
as
necessary,
the
use
the
adjustment
tab
to
bring
the
oscillator
within
tolerance.
m.
Check
2182MHz
output
pow€r.
Before
making power
measurements,
ensure
that
the
unused
port
is t€rminated
into
50O.
Unterminated ports
will
degrade
both frequency
and
power
measurements.
(1)
Check for
0 dBm +3
dB
output
power
at
the
unbuffered
port,
P220.
(2)
Connect
the
test
spectrum
analyzer
to
p222,
ter-
minate
P22O
in
50e,
then
check
for an
output
level
of
+10
dBm
*3
dB
from
the
bufiered
port.
6-35