


Theory
of
Operation
-
494A/494Ap
Service,
Vol.
1
main
lF section
for
processing
and
detection.
lF
Section
This
section
processes
the signal
for
frequency
resolution.
Several
functions
are
performed
here:
bandwidth filtering,
amplitude
calibration
and
loga-
rithmic conversion,
and
signal
detection.
The 10
MHz
lF signal
is
processed
through
one of
sev€ral
band-pass
filters
selected
by the
RESoLUTIoN
BANDWIDTH
control.
In
the auto
mode
the microcom_
puter
will sel€ct
the
best combination
of
bandwidth
and
sw€ep
time for
the
selected
span,
unless
overridden
by
the operator.
Weak
signals
can
be
amplified
by a set
of switch-
able
amplifiers
so
the dynamic
display
range
(v€rtical
window)
ls shifted
up
or
down.
The
REFERENCE
LEVEL control selects
th€
gain
and
input
RF attenuation
to
frame
this window
between
the reference
lev€l
at
th€
top
of
the display
screen
and
the
bottom
of
the display.
A leveling circuit
helps
provide
flat
frequency
response
across
the
range.
The
signal
is amplified
by a
loga-
rithmic amplifier
to
produce
the
vertical
signal
calibrat€d
in dB/div.
The
detector
produces
a voltage
that
corresponds
to th€
input
signal
strength
in
decibels.
The
detector
output
is
then sent
to the
vertical
channel
of
the
display
section
to drive the vertical
axis
of
the crt
and
display
the
signal.
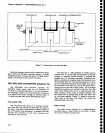
Display
Section
The display
section
draws
the
signal
on
the crt
screen. Vertical
deflection
of
the
beam
(y
axis)
is
increased as
th€
output
of
the amplitude
detector
increases.
The horizontal position
(X
axis)
of a
signal
is
controlled
by
th€ frequency
controt
section
and
corresponds
to
the frequency
of
the
detected
signal.
The Z axis, or
brightness,
is controlled
by
th€ INTEN_
SITY
control
and
the Z axis
blanking
circuits.
(However,
marker
brightness
is
actually
controlled
by stopping
the
digital storage
sweep
for
a
period
of
time
to brighten
the spot.)
As
the
spectrum
analyzer
spans
from
low
to
high
frequencies
the
beam sweeps
from left
to
right.
When
the spectrum
analyzer
tunes
through
a signal
frequency,
a vertical
deflection
shows
the
strength
of
the signal.
The
result is
a signal
displayed
at a
position
on
the
span
that
corresponds
to its
frequency,
or in other
words,
the display
shows
amplitude
as
a
function
of
fre-
guency.
O
o
o
o
O
o
o
o
o
o
o
O
o
o
o
a
o
o
a
o
o
o
o
o
o
o
o
o
a
o
o
O
a
o
o
O
o
o
o
o
o
o
o
o
7-2
The
video
amplifier
scales
the
detector output
for
vertical
deflection
in
dB/div
or
performs
a
log/linear
conversion,
depending
on
the
vertical
display
mode.
The video
processor provides
additional
bandwidth
filtering it either
the wide
or
narrow
filter is selected.
The
display
section
also
provides
crt
readout
to
show control settings
and
measurement
data.
This
readout
is
based
on
data
from
the microcomputer
which
is reading
the
settings of
the
front
panel
controls
or
data
on
the instrum€nt
and
GPIB buses.
Digital
storage
circuits
provide
two functions;
they
provide
a
flicker-free
display
at slow
sweep rates,
and
they
store
the
display
for later
viewing.
Up
to nine
different
displays
with
their readouts can
be stored
in
the battery-powered
memory. The stored
display
data
can
then be
transmitted through the IEEE-488
port
to a
plotter,
or for
programmable
instruments
to GPIB com-
patible
controllers or instruments.
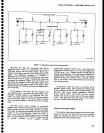
Frequency
Control Section
The
spectrum
analyzer
sweeps through a frequency
range
that
is
set by
the
frequency
control
section.
The
CENTER/MARKER FREQUENCY
control sets
the
fre-
quency
the
l st and
2nd local
oscillators.
The
output of
a sweep
generator
is
scaled
by
a
span attenuator
to sw€ep
a range
or span
of
frequen-
cies. The output of
the
span attenuator
drives the
lst
LO
for wide spans and
the 2nd LO for narrow spans.
The output
sweep
also
deflects the
crt
beam
across
the
horizontal axis as
the local
oscillators
ar€ swept so
the
display
is a spectrum of
power
versus frequency.
The frequency control
section
also
tunes the
pr€selector
so it
tracks the
signal frequency
being
detected over
the
1.7
to
21 GHz range.
Counter and
Phase
Lock Section
The
Counter,
Harmonic Mixer, and Auxiliary
Syn-
thesizer form
the
nucleus of the frequency control
hardware.
Both the
l st
LO and 2nd
LO frequ€ncies are
controlled via the firmware-based control loop. Oata
from
the
Counter
is
used
as
feedback
to
control
the
oscillator
frequency. Accurate
signal frequency
meas-
urement
is
possible
by
counting
the
frequency of the
3rd
lF.
The Phase Lock system stabilizes
the
1st Lo
fre-
quency.
This minimizes
display
jitter
and increases
resolution.