


Performance
Check
procedure
-
4g4Al4g4Ap
Service
Vol.
1
19.
Check
Gain
Variation
Between
Resolution
Bandwidths
(Less
than *0.4
dB
with respect
to
the
3 MHz fitter
and
less
than
0.8
dB
between any
two filters)
Before
performing
this
check,
do
a front panel
CAL
procedure
by
pressing
<Blue-SHIFT>
CAL
and
per_
forming
the
steps
prompted
by
the
spectrum
analyzer.
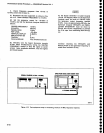
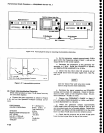
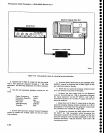
a.
Apply
the
CAL
OUT
signat
to
the
RF
tNpUT, and
set
th€
Spectrum
Analyzer
controls
as
follows:
CENTER
FREQUENCY
100MHz
SPAN/DIV
100
kHz
RESOLUTION
BANDWTDTH
3
MHz
REF LEVEL
-18
dBm
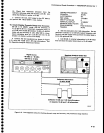
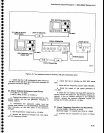
b.
Enable a
marker
by
pressing
TUNE
CFIMKR.
Tune the
marker
to the
highest
point
on
the
noise
floor.
Activate zERo
SPAN, and change
the
RESoLUTIoN
BANDWIDTH
to 3 MHz and
the REFERENCE
LEVEL as
ncessary
to
view
the
baseline.
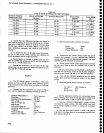
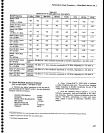
c. Check
that the noise
floor
(level)
is
down as
per
Table 4-8
(at
least
-80
dBm down if checking
a
stan-
dard instrument,
or
-31
dBmV if checking
the
7SO
input in an
Option
07 instrument).
The
REF
LEVEL
will have
to be
reset
each
tiME
thE
RESOLUTION
BANDWIDTH
iS
changed.
d.
RESET
thE RESOLUTION
BANDWIDTH
tO 1
MHZ.
e, Check
that
the noise
floor
(level)
is
down
as
per
TablE
4-8.
f.
Reset
the RESOLUTION
BANDWTDTH
to
1 00 kHz.
g.
Check
that the
noise
floor
(level)
is
down
as
per
Table 4-8.
h.
RESET
thE
RESOLUTION BANDWIDTH
tO
1O KHZ.
i.
Check
that the noise
floor
(level)
is
down
as
per
Table
4-8.
j.
Reset
the RESoLUTION BANDWTDTH
to
1
kHz.
k. Check that
the noise
floor
(level)
is
down as
per
Table 4-8.
I.
RESET
thE
RESOLUTION
BANDWIDTH
tO
1OO HZ.
m. Gheck that
the
noise floor
(level)
is
down
as
per
Table
4-8.
N. RESET
thE RESOLUTION
BANOWIDTH
tO
1O HZ.
and VERTICAL
DISPLAY
to
5 dB/DlV.
o.
Check
that the noise floor
{level)
is
down
as
per
Table
4-8.
p.
Repeat
this
procedure
for
the remaining
coaxial
input frequency
range
(1
.7 to 21 GHz).
lf
desired,
the
sensitivity
for the waveguide
bands
can
be
checked
as
per
the
listings
in Table 4-8. The values for
the 50
GHz
to 140
GHz
range are
typical
and
not intended as
a
per-
formance
requirement.
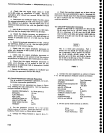
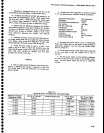
FREQ
RANGE
sPAN/DrV
RESOLUTION
BANDWIDTH
REF LEVEL
MIN
RF ATTEN
dB
VERTICAL
DISPLAY
NARROW
VIDEO
FILTER
VIEWA&VIEWB
PEAK/AVERAGE
TrME/DrV
0-1.8
GHz
MAX
10
kHz
-100
dBm
0
2
dBlDlV
On
On
Fully
Clockwise
1s
o
o
o
a
a
o
o
o
o
a
o
I
o
I
I
t
I
I
a
o
a
O
o
o
a
o
o
o
o
o
I
o
o
o
O
I
a
a
a
o
a
o
o
o
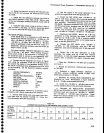
MlN
RF
ATTEN
dB
VERTICAL
DISPLAY
MIN
NOISE
TrME/D|V
0
1
dB/Dtv
On
AUTO
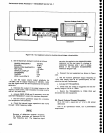
b.
Activate
the AA
mode
by
pressing
FINE.
c. Reset
the
REFERENCE
LEVEL
controt
to
position
the
calibrator
signal
at
the 7th
graticule
line
(1
major
division from
the
top),
then
activate
SAVE
A
to store
the
3
MHz
amplitude.
d. Change
the
RESOLUTTON
BANDWTDTH
to
1 MHz.
e.
check
that
amplitude
deviation
from
the 3
MHz
referenc€
is no
more
than *0.4
dB.
f.
Change
the
RESOLUTTON
BANDWTDTH
to
100
kHz
and
the FREQ
SpAN/Dtv
to
.t0
kHz.
g.
Check
that amplitude
deviation
from
the 3 MHz
reference
level
is
no
more
than
f
0.4
dB.
h.
R€p9at
the
procedure
to
check
the remaining
filters
(10kHz,
1
kHz, 100H2,
and 10
Hz)
to verify
that
the signal amplitude
does not
change
more
than
+0.4
dB
from
the
3 MHz reference
level.
i.
Check variation
between any
two filters
(0.g
dB)
by
finding
the filter
that has
the lowest
amplitude,
sav_
ing
it on the A-trace,
then
comparing
the other
filters
to
the saved
trace.
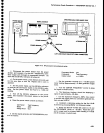
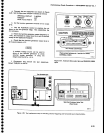
20.
Gheck Sensitivity
(Refer
to Table
4-8)
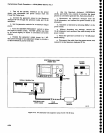
a. conn€ct
the
cAL
ouT
signat
to
the RF tNpuT,
and
perform
th€ <Blue-SHIFT>
CAL routine.
Remove
the
CAL
OUT signal
from
the
RF lNpUT,
and
terminate
the
FF
INPUT
in
its characteristic
impedance.
Set
the
Spectrum Analyzer
controls
as
follows:
4-26