


Performance
check
Procedure
-
4g4Al4g4Ap
servrce
Vor.
I
29.
Check
VERT
OUTPUT
Signal
(0.5
V
*5%
per
division
of
disptay
from
the
center
line)
a.
Monitor
the
VERT
OUTPUT
with
a
dc_coupted
test oscilloscope.
b.
S€t
the
test oscilloscope
controls
for
a
sensitivity
of 1
V/div
and a sweep
rate
of
10 ms.
c.
Set
the
Spectrum
Analyzer
controls
as
follows:
CENTER
FREQUENCY
100
MHz
SPAN/D|V
100
kHz
RESOLUTTON
BANDWTDTH
100
kHz
REF
LEVEL
-20dBm
VERTICAL
OISPLAY
2
dB/DIV
VIEW
A
and V|EW
B
Off
b.
Set TIME/D|V
to
MNL,
and vary
the
MANUAL
SCAN control
for a
five
division
beam
deflection
left
and
right of center
screen. Note
the voltage
swe€p
on
the
test Oscilloscope
as the
MANUAL
SCAN
control
is
varied.
c.
check that
the
output
voltage
varies
5 v
*.10"/o
peak-to-peak,
centered around
0 Vdc,
d.
Reset
the
TtMEiDtv
to AUTo.
Disconnect
and
remove
the
test
equipment.
OPTION INSTRUMENTS
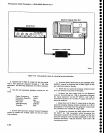
31.
Check Option
07
Calibrator
Output
(+20
dBmV
r0.5
dB)
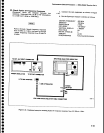
a.
Connect
the
50O
port
of
the 75o
to 50o
Minimum
Loss
Attenuator
to a
100 MHz
50O source.
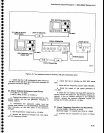
b.
Monitor
the
75o
port
of
the
75o
to 50o
Minimum
Loss
Attenuator
with
the
power
mgter.
c.
Set
the
generator
output
level
for a reading
of
-28.95
dBm on
the
power
meter.
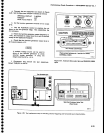
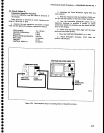
d. Disconnect
the
power
meter
from
the
7SO
port
and
connect
the 75O
port
to
the
75O
INPUT
of
the
Spectrum Analyzer
via
a
75O cable.
e.
Set the
Spectrum
Analyzer
controls as follows:
d. Apply
the
cAL
oUT signat
to
the
RF
tNpUT
and
verify
that
the
signal
amplitude
is full
screen.
lf not,
perform
the
<Blue-SHIFT>
CAL
routine.
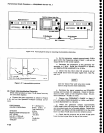
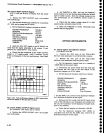
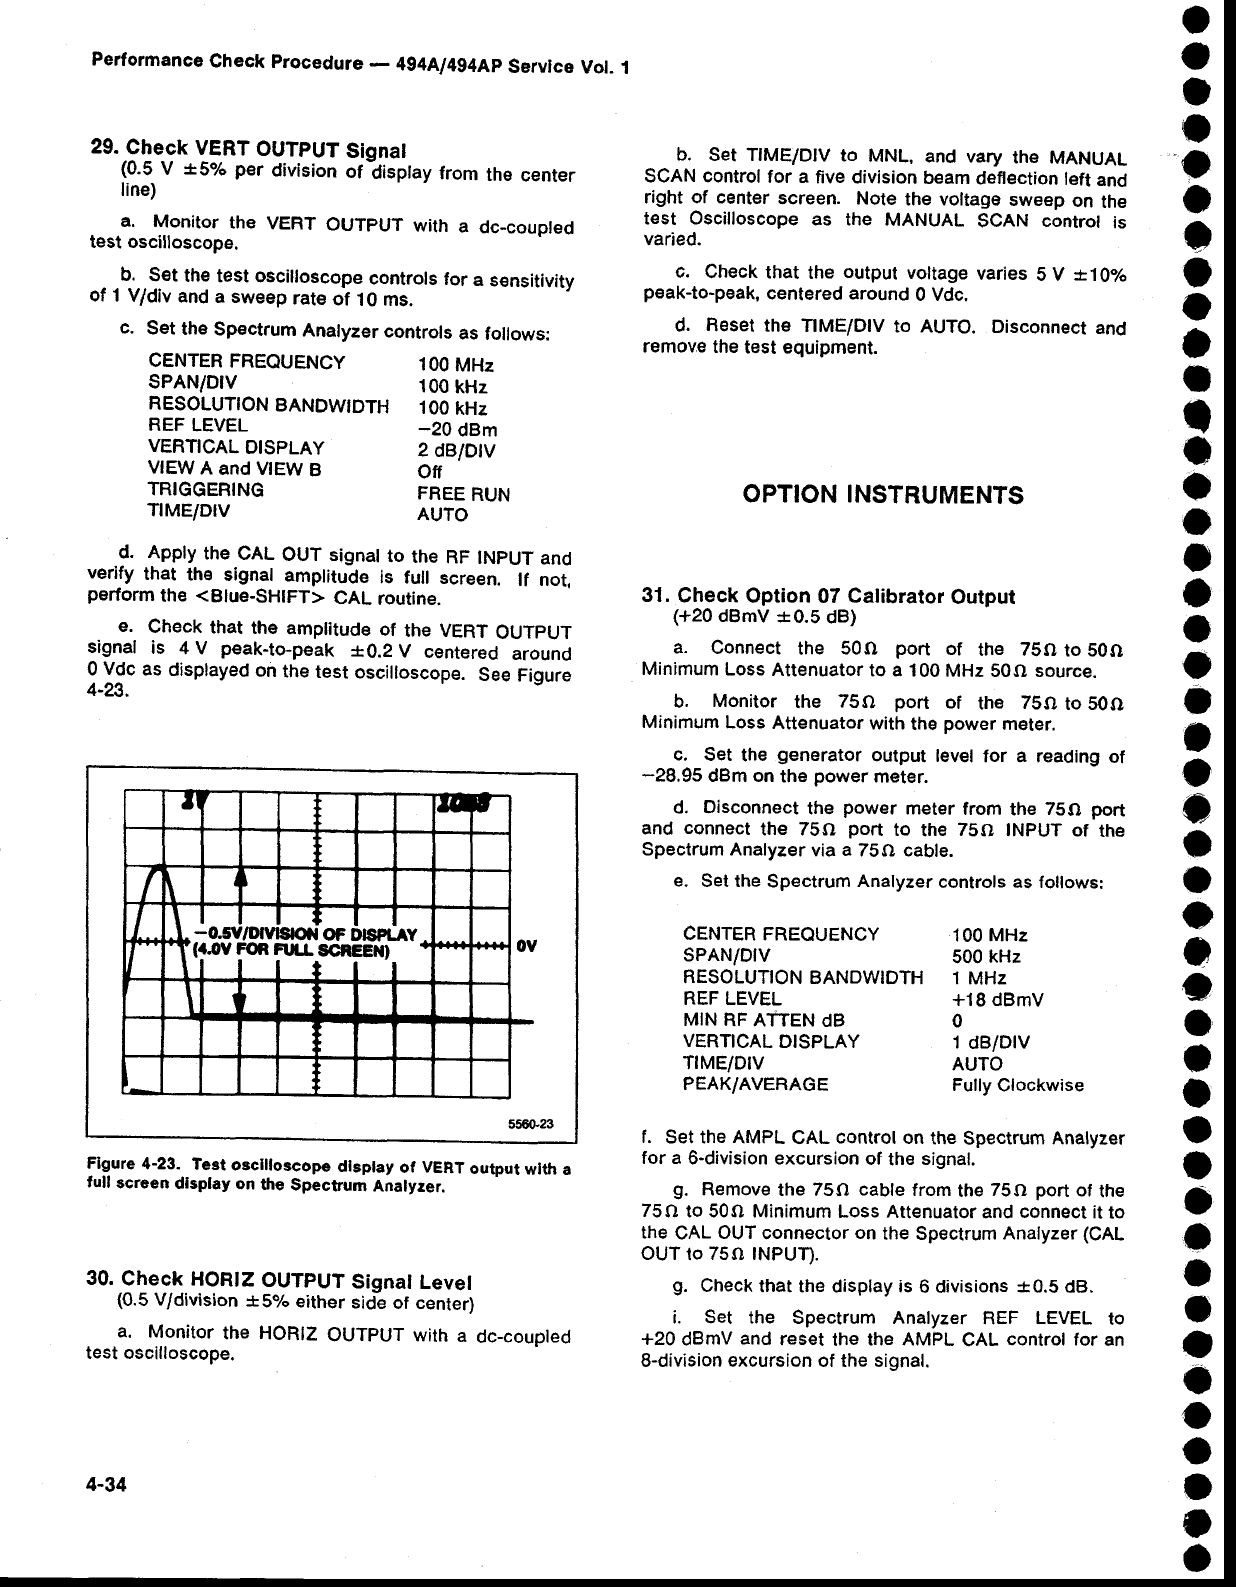
e.
check
that
the
amplitude
of
the VERT
ouTpuT
signal
is
4 V
peak-to-peak
+0.2
V
centered
around
0
Vdc
as
disptayed
on
the
test
oscilloscope.
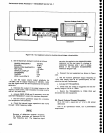
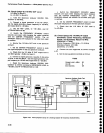
See
Figure
4-23.
Flgure
4-23.
Test
oscllloscope
dlsplay
of
VERT
output
wlth a
full
screen
dlsplay
on
the
Spectrum
Analyrer.
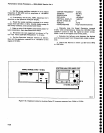
30.
Check
HORIZ
OUTPUT
Signat
Level
(0.5
V/division
*syo
either
sid-e
of center)
a.
Monitor
the HORIZ
OUTPUT with
a
dc_coupted
test oscilloscope.
TRIGGERING
TrME/DlV
FREE
RUN
AUTO
CENTER
FREOUENCY
sPAN/DrV
RESOLUTION
BANDWIDTH
REF LEVEL
MIN
RF ATTEN
dB
VERTICAL
DISPLAY
TrME/DlV
PEAK/AVERAGE
100 MHz
500
kHz
1
MHz
+18 dBmV
0
1
dB/DrV
AUTO
Fully
Clockwise
f.
Set the AMPL
CAL
control
on
the
Spectrum
Analyzer
for a
O-division excursion
of
the
signal.
g.
Remove
the 75O
cable
frorn
the
75O
port
ot
the
75O
to 50O Minimum
Loss Attenuator
and
connect
it
to
the
CAL
OUT
connector
on
the Spectrum
Analyzer
(CAL
OUT
to
75o INPUT).
g.
Check
that the
display
is
6
divisions
*0.5
dB.
i. Set the
Spectrum Analyzer
REF
LEVEL
to
+20
dBmV
and
reset
the
the AMPL
CAL
control for
an
8-division
excursion
of the signal.
a
t
t
I
I
[-i3fi
rrttl
'/DIYISP}I
OF
DISPLAY
.
FORFIL|.SCREEX)
{
lltrl
OY
4-34