


Theory
of
Operaton
-
4g4Al4g4Ap
Service,
Vol.
I
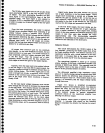
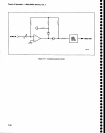
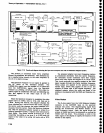
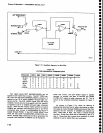
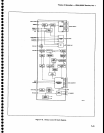
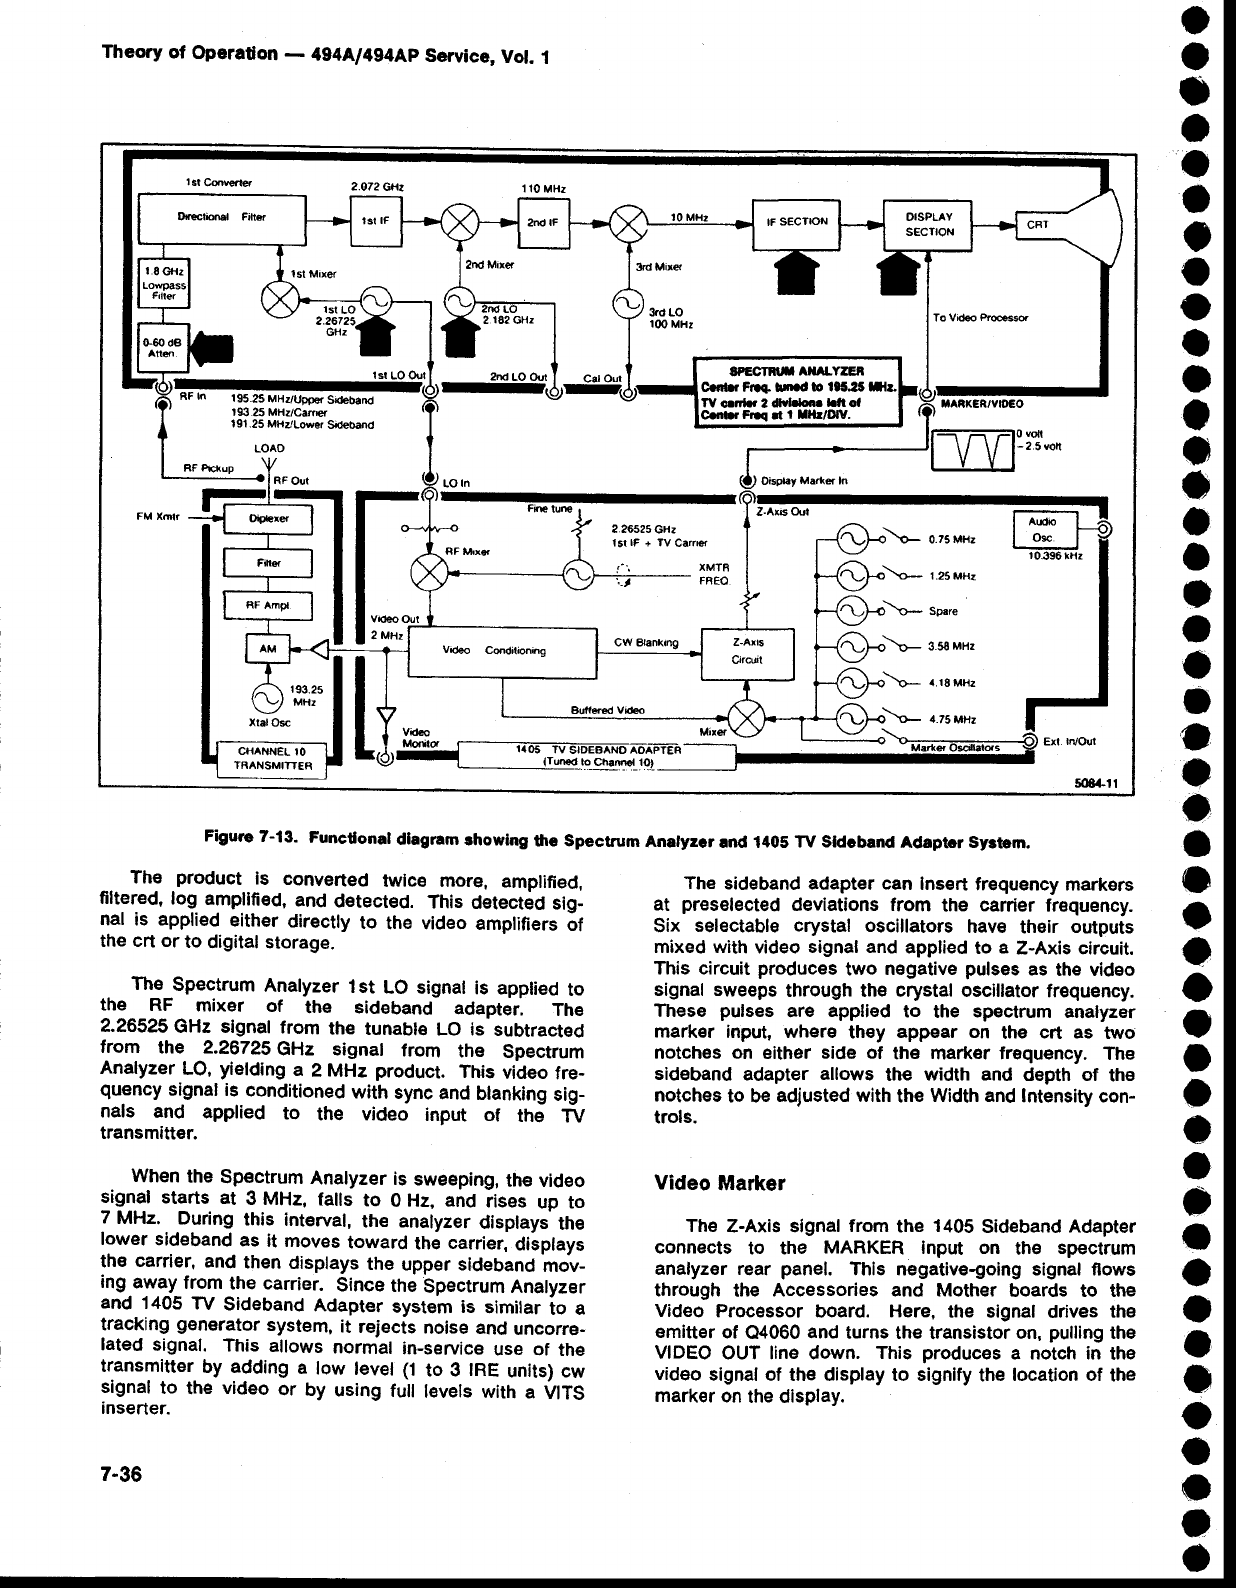
Figure
7-13.
Functonal
dlagram
rhowing
the Spectrum
Anafyzcr
and 1405
TV Sldcband
Ad.picr System.
The
product
is
converted
twic€ more,
amplifi€d,
liltered,
log
amplified,
and
detected.
This
detectdO
sig-
nal is applied
either
directly
to
the video
amplifiers
of
the crt or
to
digital storage.
The
Spectrum
Anatyzer
lst
LO signat
is applied
to
the
RF
mixer
of
the sideband
adapter.
The
2.26525
GHz signal
from
the
tunable
LO is
subtract€d
from
the 2.26725
GHz signal
trom
the
Spectrum
Analyzer
LO,
yielding
a
ZMHz
product.
This
video
fre-
quency
signal
is
conditioned
with
sync
and
blanking
sig_
nals
and
applied
to
the video
input of
the
T\/
transmitt€r.
When
the
Spectrum
Analyzer
is
sweeping,
the video
signal
starts
at
3 MHz,
lalls
to
0
Hz, and
rises
up to
7
MHz.
During
this
intervat,
the analyzer
displays
the
lower
sideband
as
it moves
toward
the
carrier,
diiplays
the
carrier,
and
then
displays
the
upper sideband
mov_
ing
away
from
the carrier.
Since
the
Spectrum Anatyzer
and
1405
TV
Sideband
Adapter
system is
similar
io a
tracking
generator
system,
it
rejects
nolse and
uncorre-
lated
signal.
This
allows
normal
in-service
use of
the
transmitter
by adding
a
tow
tevel (1
to 3
tRE
units) cw
signal
to
the
video
or
by
using
fuil
levets with
a
ilTS
inserter.
7-36
The
sideband adapter can
lnsert
frequency markers
at
preselected
deviations from
the
carrier
frequency.
Six
selectablo
crystal
oscillators
have
their
outputs
mixed with
video
signal and
applied
to
a
Z-Axis circuit.
This circuit
produces
two
n€gative
pulses
as
the video
signal sweeps
through tho crystal oscillator
frequency.
These
pulses
are
applied
to
the
spectrum
analyzer
mark€r input, whers
they
appear on
the
crt as
two
notch€s
on
either
side of
th€ marker frequency.
The
sidEband
adapter
allows
the
width and
depth of
th€
notches
to be
adjusted with
the
width and
Intensity con-
trols.
Video
Marker
The
Z-Axis signal
from
the
1405
Sideband
Adapter
connects
to the
MARKER
input on
the
spectrum
analyz€r rear
panel.
This negative-going signal flows
through
the
Accessories and Mother
boards to the
Video
Processor
board.
Here,
the signal
drives
the
ernitter
of
Q4060
and
turns the
transistor
on,
pulling
the
VIDEO
OUT line down.
This
produc€s
a notch in
the
video
signal of the display to signify
the
location of
the
marker
on
the display.
RF ln
'l
95.25 MHz/Uppsr
Sdeband
t93
25
MHz/Cars
19t.25
MHzIL@d
Sirebad
LOAO
trA8X€R/VtO€O
rcll
-2.5
6lt
Oisglay
MaA6 h
ffi
rffi
Z-Ax6
o(rl
i\r o.TsMHr
i\o- r.zsMHr
i\\o*
sprre
i\o-
3.5s
MHz
i\-..rsMHz
i\'o-
4.75
MHz
!@_f9sEs9Ll9l
Ert.
l.Voui
5(n+fi
?.26525
GHz
lst
lF
+ fV
Carrs
ToVid@Pcq