


Performance
Check
procedure
-
494A/4g4Ap
Service
Vol.
1
d.
Check
that
the
signal
steps
down
in
10
dB
(r1.0
dB)
steps
as
attenuation
is
added.
Maximum
cumulative
error
should
not
exceed
2.0
dB over
the
80
dB range.
e.
Deactivate
the
NARROW
VTDEO
F|LTER,
return
the
external
attenuation
to
0 dB, and
change
the VERTI-
CAL
OISPLAY
to
2
dB/DlV.
Set the
signat
peak
at
the
reference
(top) graticule
line,
with
the
generator
output
control.
f.
Add
16
dB of
external
attenuation
in
2
dB steps,
and
note
that
the
display
steps
down
in
2
dB steps.
g,
Check
the
display
accuracy
as
attenuation
is
added.
Error
should
not
exceed
+6.+
aep
dB step,
or
exce€d
a
cumulative
error
of +1.0
dB over
the i6
dB
window.
h.
Return
the external
attenuation
to 0
dB.
change
the VERTTCAL
DlSpLAy
to LtN.
Set
the
signal genera-
tor output
for a
full
screen
display.
i.
Check
that
the
signal
amplitude
decreases
ro
within
*0.4
divisions
of
half
screen
as
6
dB
of
external
attenuation
is
added.
j.
Check
that
the
signal
amplitude
decreases
ro
within
i0.4
divisions
ot
114
screen
or
hatf
the
previous
amplitude
as an
additional6
dB
of
att€nuation
is
added.
k.
Check
that
the
signal
amplitude
decreases
to
within
*0.4
divisions
ot
1lg screen
or
half
the last
amplitude
as
an
additional
6
dB
of
attenuation
is added
(for
a
total of 18
dB).
t.
Return
ths
vERTtcAL
DtspLAy
to 1o
dB/Dtv
and
disconnect
ths
generator
from
the RF
lNpUT.
16.
Check
Preseleclor
Ultimate
Rejection
This
is
a
check
of preselector
opeiation,
not
a
per_
formance
requirement
specification.
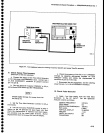
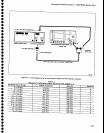
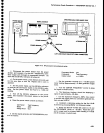
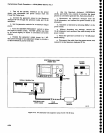
a.
Connect
the
test
equipment
as
shown
in
Figure
4-13,
omitting
the step
attenuators.
Set
the
Spect-rum
Analyzer
controls
as
follows:
CENTER FREOUENCY
3.S
GHz (Band
2)
SPAN/D|V
10
kHz
AUTO
RESOLN
On
REF
LEVEL
0 dBm
VERT|CAL
DTSPLAY
10
dB/Dtv
MIN
RF ATTEN
dB
O
WIDE
VIDEO
FTLTER
On
T|MEIDIV
AUTO
b.
Set
the
generator
controls
for
a
full
screen
display
output
at
3.S
GHz.
peak
the response
with
the
MANUAL
PEAK
controt
or
pEAK
MENU
mode.
_
c.
Change
the FREQ
RANGE
to
band
3
(3.0_7.1
GHz).
d.
Check
that
spurious signals
are
at least
too
dB
down from
the level
established
in
part
b. Spurious
sig-
nals above
100
dB
down
from
the reference
estabtished
in
part
b indicate
that the
ylG-tuned
preselector
filter
could
be defective.
o
o
O
o
a
o
o
o
o
a
I
o
o
o
a
o
t
O
o
o
o
t
o
o
o
o
a
o
o
o
I
t
o
o
a
o
I
a
a
o
o
o
o
o
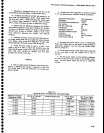
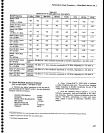
17.
Check RF
Attenuator
Accuracy
(Within
0.5
dB/10
dB
to a maximum
of 1
dB over
the
60 dB
range
from dc
to 1.8
GHz; within
1.5
dB/tO
dB to a
maximum
of
3 dB over
the
60 dB
range
from 1.8
GHz
to
18
GHz; and
within
g
dB/10
dB
to a
maximum
of
6 dB
over
the
60
dB range
from
1g
GHz to 21
GHz)
This
is a
three
part
procedure.
part
I
checks
the
first
30
dB
(0-30
dB) range
of
the
rf attenuator,
Part
ll
checks
the remain-
ing
30 dB
(30
dB-60 dB)
range for
fre-
quencies
up
to 18 GHz, and
part
lll
checks
the
50 dB
to
60 dB
step
of
the
RF Attenua-
tor
lor frequencies
above
18
GHz.
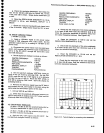
PART
I
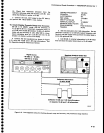
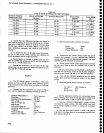
a. Connect
the
test
equipm€nt
as
shown in
Figure
4-14.
Set
the
Spectrum Analyzer
controls
as follows:
CENTER
FREOUENCY
SPAN/DIV
RESOLUNON
BANDWIDTH
REF LEVEL
MIN RF ATTEN
dB
MIN
NOISE
PEAK/AVERAGE
VIEW
A and
VIEW
B
Test
Freguency
200 kHz
100 kHz
-30
dBm
o
On
Fully
Clockwise
On
VERTfCAL
DISPLAY
2
dBlDtV
NARROW
VIDEO
FILTER
On
T|ME/D|V
AUTO
b.
Set
the
power
meter controls
as follows:
Mode
Watts
Range
Hold
Out
Power
Reference
Out
4-20