EDIT Menu
AWG2021 User Manual
3 Ć23
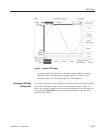
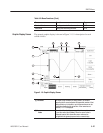
Graphic Display
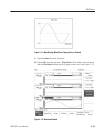
In graphic display, the waveform is displayed in graphic form in the waveform
editor and it is created or edited in that form. The horizontal axis indicates time or
number of points, while the vertical axis indicates the levels. Waveforms are
displayed at each data point in 12-bit resolution. On the beneath the waveform, the
on/off state of the marker signal is displayed in timing form. All editing operations
are performed between the two vertical bar cursors.
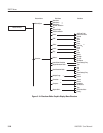
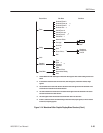
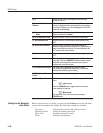
Figure 3 -14 is a diagram showing the menu structure for the waveform editor in
graphic display. This is not a complete list; for a complete list, see the diagram at
the beginning of the section on each menu. An ellipsis (...) next to an item in the
side menu indicates that there is a sub-menu below that item listing additional
choices. Commands in the sub-menu are executed with the Execute command;
when Go Back is selected, the sub-menu disappears and the side menu
reappears.


